Last time we discussed what severe weather is. We also discussed some aspects of where we find such phenomena within a thunderstorm.
Now that we know what severe weather is, we will discuss where severe weather comes from.
The vast majority of severe weather comes from thunderstorms. So, when we ask the question, "Where does severe weather come from?" what we are really asking is, "Where do thunderstorms come from?"
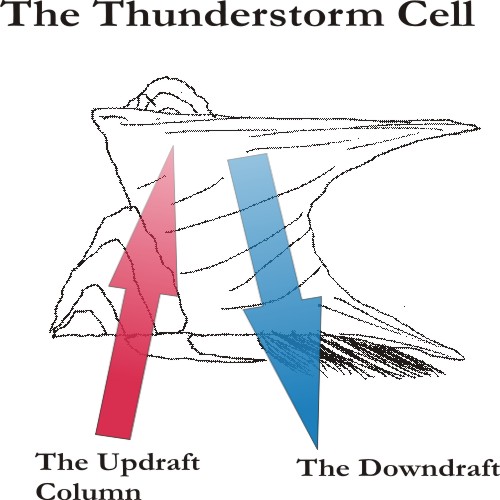
If we look at a thunderstorm,
We will see that it is in two parts, the updraft and the downdraft. While this does not tell us where the thunderstorm comes from, it does give us a clue. Which comes first, the updraft, or the downdraft, or both? The updraft seems to be what starts the thunderstorm going. We will discuss the life-cycle of a thunderstorm in the next lesson. What we want to know here is what gets the air to begin rising
It turns out that there are several things that can get the air to rise:
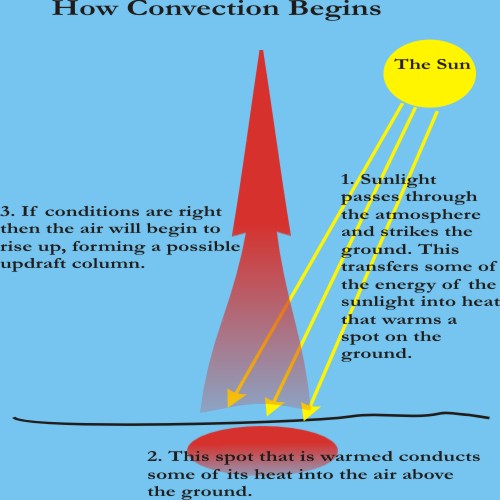
Convection
This is the most common notion of how air rises:
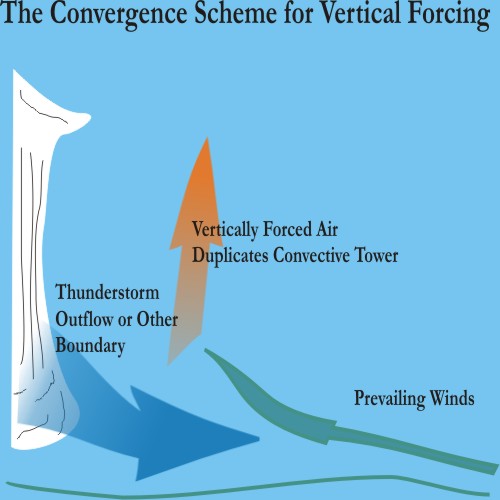
Convergence
This occurs when winds at the ground run into each other coming from different directions. The leading edge of these winds are called boundaries:
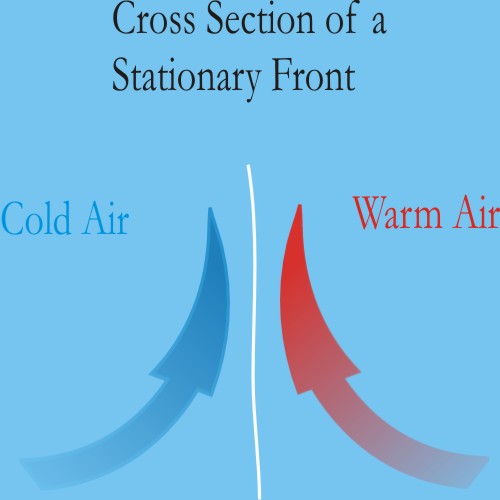
Fronts
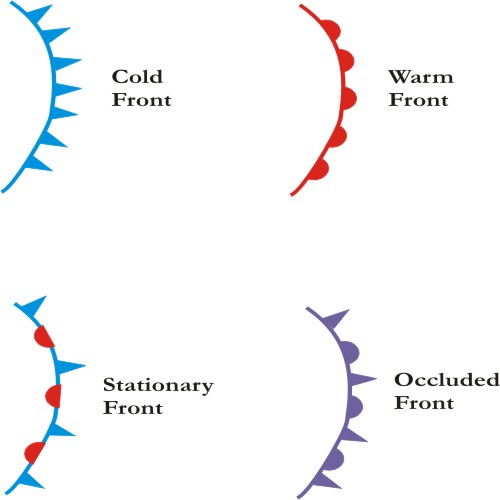
We have all seen these on the weather maps. They represent the boundary between warm and cold air. These are often a focus of thunderstorm development. We will begin with a stationary front, here we have two air masses that sit next to each other. There is very little movement in the position of a stationary front.
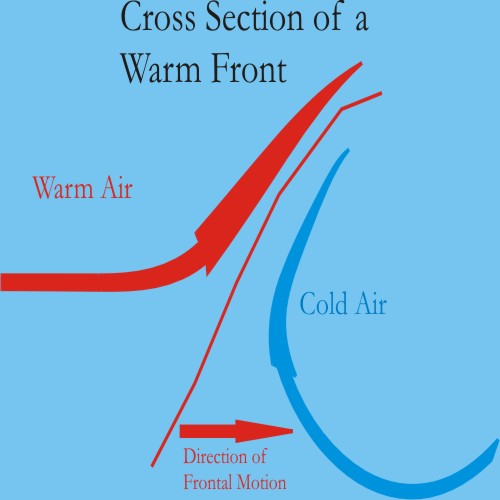
Next we have a warm front. Here warm air is pushing into and over cold air.
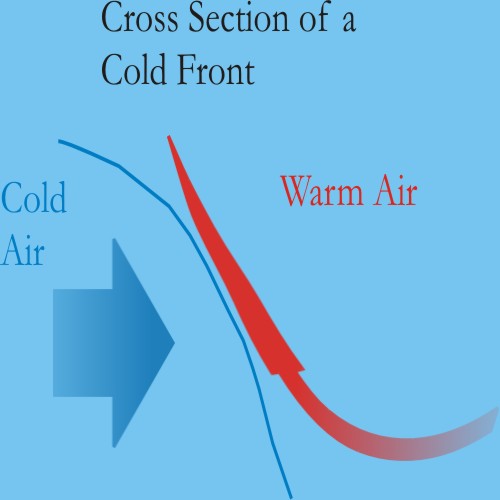
Here we have a cold front, where cold air is moving into an area of warm air, which is forced up and over the colder air at the surface.
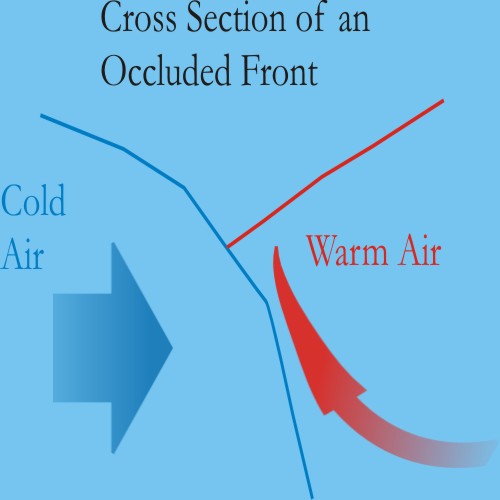
An occluded front occurs when a cold front catches up to a warm front. In the picture below we see that the warm front is actually being lifted up over the top of the cold front. The rising air at the leading edge of the warm front will be forced to rise even faster now. A similar situation can result if the cold front rises up and over the warm front.
There are two ways of finding a front on the map:
Look for station models on a map. They are of this form:
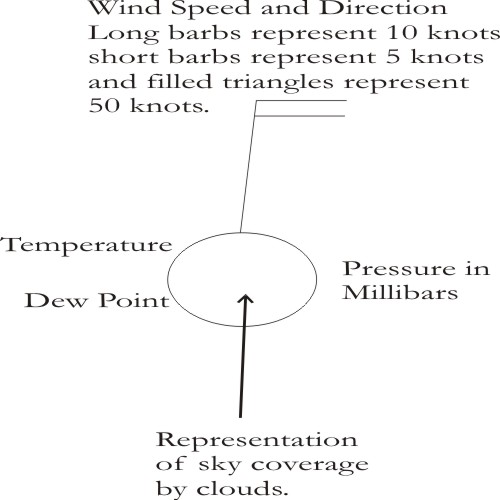
Note that the direction the wind bnarb is pointing is the direction the wind is coming from.
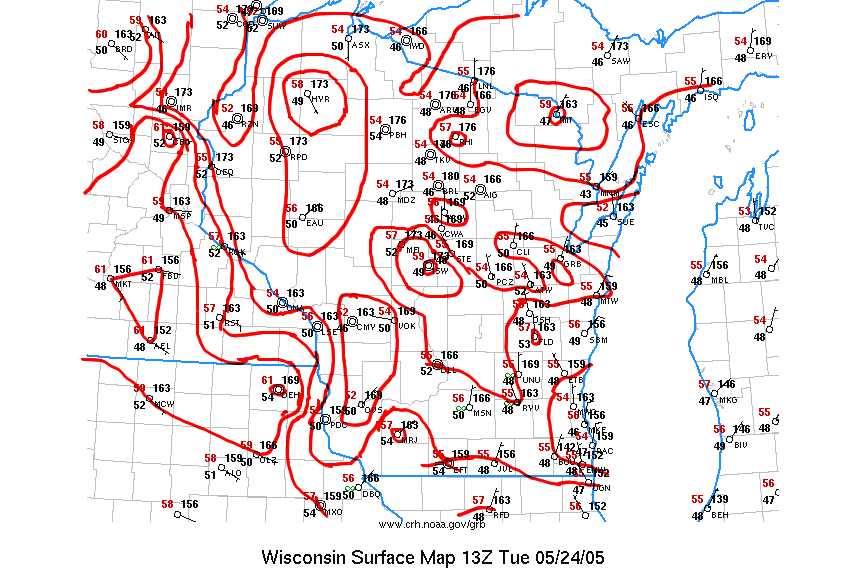
Use a pencil and lightly draw lines between station models that have the same temperature. Boundaries are located where lines of different temperature are nearly parallel. Sharp differences in temperature between stations can indicate the presence of a front. To see good examples of this, look at a surface analysis that plots fronts alongside surface analyses that show only surface models.
Here I do something of this nature on a local map, I draw lines to illustrate every 2 degrees of temperature. Note that I have to guess where these lines will be by comparing the temperatures at various station models.
Think about the definitions of fronts and why storms form along them.
Use a pencil and lightly draw arrows extending in the direction of the wind flow on the station model. When these arrows angle towards each other you have convergence. You can find flows of the surface winds on maps that display what are called streamlines. When you see these streamlines getting closer together, you have convergence.
Using national maps is not sufficient to locate most smaller-scale changes or convergence that can effect individual storms. You need to get access to close-in maps of your state, or even better the part of the state you live in. Most NWS forecast offices will have web links to such maps that can be printed out.
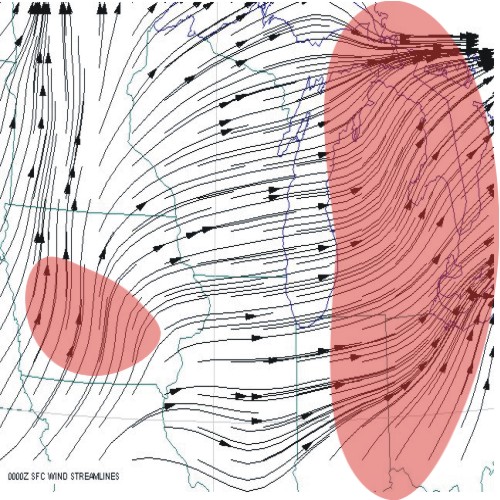
Here the shaded areas indicate areas of strong convergence.
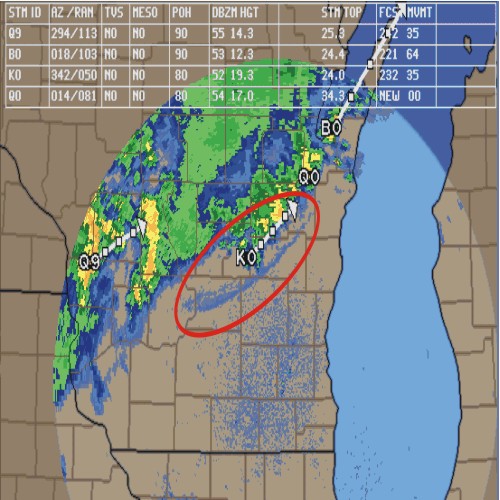
Once you have such a map you can locate where storms are located (where the forcing mechanisms are) and the paths they will likely take through your area (the upper level winds that will actually steer the thunderstorms). You can then predict where you will find convergence between storm outflow and local wind fields. In some cases you will be able to locate such outflow boundaries on NWS Doppler radar (and rarely using the radar displays from TV stations). Often these outflow regions will act like small cold fronts and will be present for hours (or until another storm comes through to move them). Here is such an outflow boundary from the WSR-88D located at the Sullivan WFO, the specific area of the outflow boundary is within the red ellipse.
Here is an example, where the red arrow indicates the presence of a large thunderstorm and its path. The blue shading indicates the location of new convergence, and the likely location of an outflow boundary.
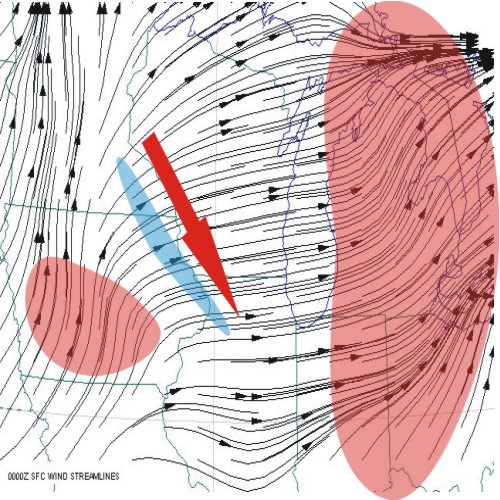
Discuss the significance of storm outflow when anticipating where convergence will occur.
Here is the vertical sounding plot for the night of the Oakfield Tornado in Wisconsin. This type of plot gives us the temperature (right-most thick line), dew point (left-most thick line), and wind (wind barbs on the right) profiles with height. It uses the millibar scale for altitude on the far left side. Temperatures are in the Celsius scale.
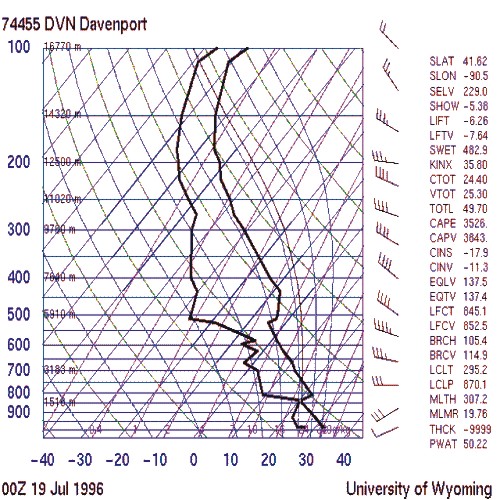
Two types of shear are usually required for severe development (though one will do). The first is directional shear (that is winds at the surface are moving in a different direction than winds at 700 or 600 millibars). The second kind is called vertical speed shear (that is winds increase with altitude). Note the wind barbs on the right-hand side between the surface and 600 millibars have about 30 degrees of directional shear. The surprising thing about this plot is that vertical speed falls off with height. Most storms usually require this to increase with height (we will explain why in the next lesson).
The amount of energy available for convection in the atmosphere is called the CAPE (Convective Available Potential Energy). On the chart below this number is the area of the region in green. The larger the area, the more energy is available and the stronger storms will be if this region can be reached by an ascending convective column. The thing that can stop it is the area bounded by the orange and red lines, this is called the Cap and the thicker this layer is the harder it will be for convection to get through it. In this case it represents a layer of warm dry air.
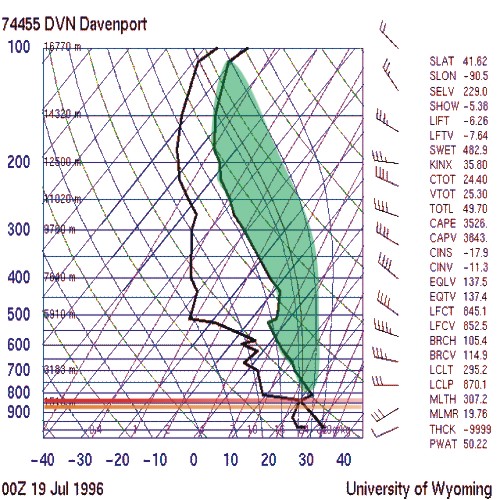
Speculate on the significance of thick and weak caps with regards convection.
Click here to back to the Spotter Basic Training Page
Click here to back to the Spotter Network Training page.
Click here to back to the Spotter Network page.
Click here to back to our home page.